8 Best Java Monitoring Software for Businesses [2023]

Java is a very popular, tried, and tested object-oriented programming language for building enterprise applications, web applications, and mobile applications. Because of Java’s reliability, scalability, and platform independence, it has been extensively used to build critical systems across industries such as finance, aerospace, healthcare, retail, and logistics.
In fact, according to Oracle, the company that owns Java, as of 2016, 15 billion devices were running Java, and as of 2017, there were 38 billion active Java Virtual Machines(JVMs) and 21 billion cloud-connected JVMs. A Java Virtual Machine(JVM) is the runtime environment that executes Java applications.
All these point to the fact that at any given time, there are billions of critical business transactions happening which are powered by Java applications. Therefore, being able to monitor the performance of Java applications is important in ensuring the high performance of critical Java applications. This is known as Java monitoring.
Java monitoring refers to observing, measuring, and analyzing the performance and behavior of Java applications. This is done by using Java monitoring software to track key JVM metrics in order to gain full visibility and insights into the health, performance, and behavior of a Java application.
Importance of Java Monitoring

Java monitoring is a crucial process, particularly with enterprise Java applications which are complex, handle large amounts of data, and power critical business transactions. Such applications are expected to be reliable and perform optimally at all times.
Java monitoring has the benefit of ensuring optimized performance and proper resource allocation in Java applications. Monitoring provides in-depth information on how an application performs under different conditions to identify areas of improvement.
Such information also helps in informing decision-making on optimal resource allocation for an application to ensure the availability and proper utilization of needed resources.
Java monitoring also allows for proactive issue detection. Java monitoring solutions monitor a Java application and send alerts and reports on issues identified in the application. This allows development teams to handle the issues before they lead to major problems in the application.
Monitoring can also help in improving a Java application’s security posture as it can help detect unusual activity and potential security breaches in the application by analyzing system logs and patterns in the software.
Additionally, it can help in improving the user’s experience with the application by minimizing downtimes, improving response times, and minimizing errors and bugs in the application. To cap it all, Java monitoring helps businesses and organizations save costs.
Metrics monitored in Java Monitoring
Some of the key metrics that are monitored during Java monitoring include:
Memory Usage

For code to run, it needs memory. In JVM-based applications, an area of the memory called Heap memory is used for creating and storing objects. As users access applications and make requests, more objects are created, increasing the amount of heap memory used.
Heap memory usage also increases relative to the amount of data being processed. Once processing is completed and requests handled, objects created in those operations should be cleared to create space to create new objects.
If this is not done, it indicates a memory leak. If there’s no space to create more objects in the heap memory, an OutOfMemory error occurs, which can stop the JVM and crash an application.
Monitoring memory usage, particularly the heap memory, should be done to identify memory leaks and errors such as OutOfMemory errors.
Garbage Collection
Clearing unreferenced or no longer-needed objects from the heap memory is done through garbage collection, an operation that is run by the JVM. Garbage collection is a resource-intensive process, and it also suspends the execution of an application until it is complete.
If garbage collection happens too often or a garbage collection cycle takes too long, the performance of an application, particularly its responsiveness, will be affected. The overall JVM performance is also affected, and thus it is important to monitor how often garbage collection happens and how long it takes.
JVM Threads
Java applications work and handle user requests using threads. Just like operating systems perform operations using processes, the JVM does the same using threads.
When there are too many active threads, more resources will be required, such as CPU utilization and memory usage. If there are too many threads in your application, your application and server will lag and be slow because of the intense resource usage by the high number of threads.
A lot of active threads could also be an indication that your application’s backend is malfunctioning. However, it is important to have enough threads to handle user requests. If threads are not enough, your application’s response time increases.
It is, therefore, important to monitor the number of active threads to ensure optimal application performance at all times.
When it comes to monitoring these key metrics in your Java application, there are a number of tools that will allow you to monitor and ensure high performance in your application. Some excellent tools for this include:
ManageEngine Applications Manager

ManageEngine Applications Manager is a feature-rich Java Monitoring tool used by companies such as Airbus, Graincorp, and Costco.
ManageEngine Applications Manager equips you with a tool that allows you to monitor and troubleshoot Java application performance, get deep insights on your Java application servers, monitor the health and performance of JVMs and the Java Management Extensions (JMX), and also help you with fault management and reporting.
ManageEngine Applications manager’s JVM monitoring provides real-time information on the heap and non-heap memory usage and extensive thread details and allows you to monitor Java’s Garbage Collection, thus ensuring your application’s responsiveness is not affected.
Finally, ManageEngine Application’s Manager allows you to optimize the performance of Java-based application servers by tracking critical key performance indicators such as concurrency, memory metrics, JDBC, JVM, and JMS metrics.
SolarWinds Server & Application Monitor

SolarWinds® Server & Application Monitor (SAM) is an all-around tool that is specially designed to monitor, improve and optimize the performance of Java Application Servers, in turn improving the performance of Java applications.
A Java application server is a Java Virtual Machine that provides an environment for running Java-based enterprise or user applications. SAM allows the monitoring of servers at both a hardware and software level, and it sends alerts on discovered issues so that they can be addressed before they lead to major problems.
Since organizations oftentimes use Java application servers from multiple vendors, SAM allows users to easily monitor servers from multiple vendors from one interface. For this, it provides highly customizable templates and features, allowing users to have full control over what they want to see about their servers and how they want to see it.
Using SAM, users can monitor Java application server metrics such as heap and non-heap memory size and usage, garbage collection, databases, and performance of Java applications running on the server. It also allows users to keep an eye on concurrency in addition to monitoring the performance of Java Web applications.
New Relic Quickstart

New Relic Quickstart for Java is a Java monitoring tool that comes with an intuitive, aesthetic, and user-friendly dashboard where key Java application metrics are reported. The dashboard shows average CPU utilization, memory heap used, garbage collection CPU time, and the top 5 slowest transactions, among other details.
New Relic Quickstart comes with a Java agent that monitors databases, app servers, and message queuing systems. It also allows for JVM-level observability, thus providing insights on transactions, HTTP sessions, and thread pool data.
The Java agent also allows you to trace request flows through distributed systems so that you can easily pinpoint points of failure and proactively prevent downtimes. The agent also supports custom instrumentation for add-on Java frameworks and libraries, which may be used with applications.
Through its dashboard, users get a visual display of a Java application’s performance. New Relics also provides four alerts, that is high CPU utilization, transaction errors, average transaction duration, and average heap memory used. These alerts can be used to detect and report changes in key Java application performance metrics.
AppDynamics

Cisco’s AppDynamics Java Monitoring tools are a free set of tools for Java monitoring. AppDynamics supports all JVMs and application servers with Java 1.5 and above. It also offers a full framework and protocol support to give users full visibility into their Java applications.
AppDynamics adds your application’s context when looking at JVM metrics and also allows you to monitor the performance of business transactions and associated code as your application’s JVM is running in production. This is in addition to providing customizable alerts for when issues arise in an application.
AppDynamics allows you to track response time, service levels, and throughput of business transactions. It also supports drilling down to the code execution of the transactions in your Java application.
In the event that you identify slow requests or transactions in your application, AppDynamics, in a single click, gives you a view of the full code execution stack. This allows you to easily pinpoint where time was spent in your JVM and code, thus helping in removing performance bottlenecks in Java applications.
Datadog

Datadog offers Java monitoring tools that are geared towards providing a single platform where users can get full visibility of Java applications, never miss critical, and can troubleshoot and optimize their Java applications down to the line of code, particularly in distributed systems.
Datadog provides real-time end-to-end Java monitoring, which allows you to analyze every request and find ways to optimize your application’s performance. It also ensures the successful deployment of every version of Java code and allows the monitoring of dependencies and the health of Java services.
Another key offering of Datadog is centered around troubleshooting and application optimization. Datadogs allows monitoring Java services down to the line of code to reduce error, optimize resource consumption, and reduce latency bottlenecks in Java services.
Best of all, Datadog allows you to build dashboards that combine different metrics being monitored by Datadog, thus providing easy visibility into your application’s performance.
Dynatrace

Dynatrace is a solid and feature-rich Java monitoring tool that is used by companies such as Dell, SAP, and Kroger and supports all common Java frameworks. Dynatrace allows you to monitor JVMs, servers, Java applications, and database queries in real-time to improve the performance of your Java code.
To understand the performance of your applications, Dynatrace provides key Java performance details such as JVM metrics, garbage collection, Java-managed memory, busy and idle threads, and web request and response size, among many others.
To avoid bloated dashboards, Dynatrace gives you an overview of what you need to know about your Java applications, then provides the capability to dive deeper into each metric and transaction and get more details.
Dynatrace also automatically detects and diagnoses problems and points you to the root cause of the problem before end users are affected. It also allows you to easily find and resolve performance issues and bottlenecks in your application. Dynatrace is packed with lots of features and is definitely a tool worth looking into.
Site24x7

Site24x7 offers Java monitoring tools that track key JVM metrics across various platforms and debug errors to optimize the end-user experience. It allows real-time monitoring of the performance of Java applications, viewing slow SQL queries and distributed traces, and offers users AI-powered outage alerts for their applications.
With Site24x7, you can monitor JVM metrics such as CPU usage count, memory usage, garbage collection, and threads summary. Additionally, you can configure alerts for when there’s an issue with any of the metrics.
Additionally, developers can easily trace slow-performing methods and functions in their code and evaluate database calls to know which are the most hit database tables, busiest tables, and most executed database transactions with their response times.
Site24x7 also offers a unique feature where you can track the performance of specific features or modules in your application and background transactions such as schedulers and maintenance.
SolarWinds AppOptics
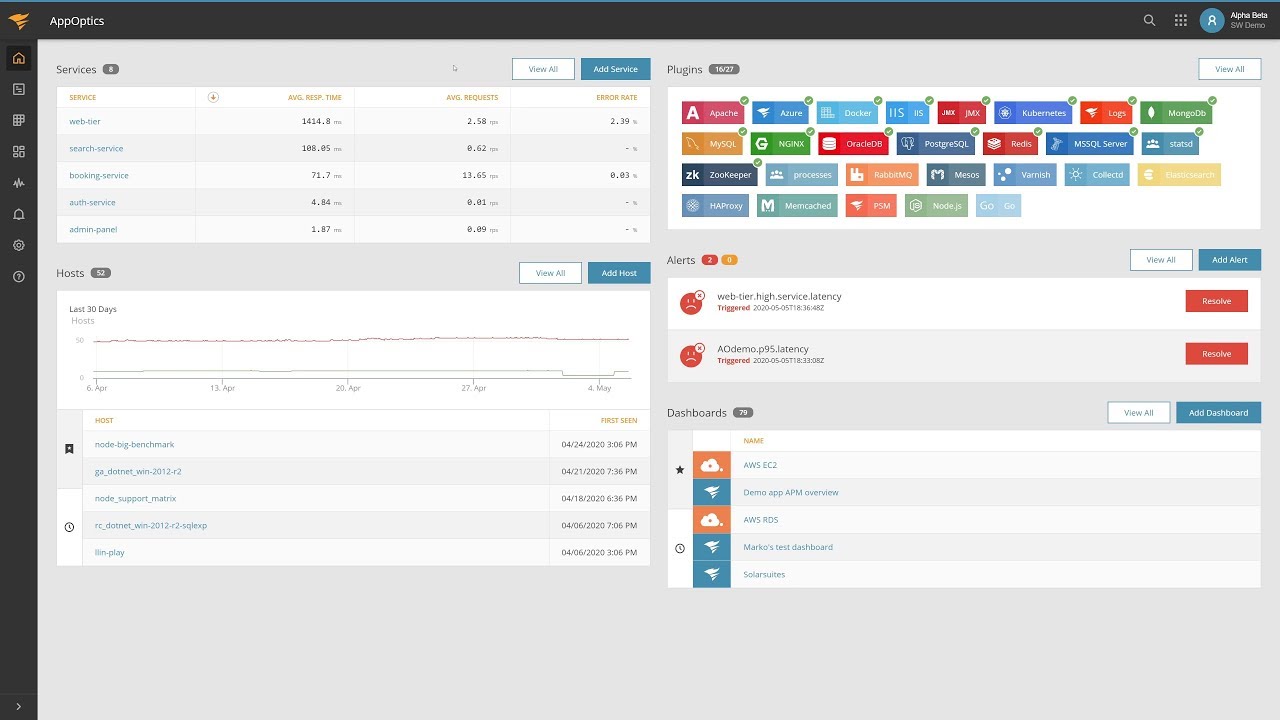
SolarWinds AppOptics is a Java monitoring tool that makes it easy to hunt down performance bottlenecks in Java applications and servers and deliver high-performing Java applications. AppOptics does instrumentation automatically to make the process of Java monitoring simpler for users.
SolarWinds AppOptics can also trace application requests using distributed tracing to find flaws in how transactions are happening in an application.
This can also help uncover areas that are causing latency in performance. Additionally, this tool can perform live code profiling to help you pinpoint issues in your Java application down to the line of code causing the issues.
AppOptics can be integrated with other SolarWinds tools, such as Pingdom and Loggly, to create a more comprehensive tool with support for real-time monitoring of applications.
Conclusion
Java monitoring is a crucial process in any Java application. To ensure high performance in your Java application, better security, fewer bugs, fast response times, and little to no downtime, consider using the Java monitoring tools shared in this article.
Not only will it make your application better, but it will also save your business money and make your customers and users happier.
You may also explore the best JBoss monitoring tools.
-
 Collins KariukiAuthorCollins Kariuki is a software developer and technical writer for Geekflare. He has over four years experience in software development, a background in Computer Science and has also written for Argot, Daily Nation and the Business Daily Newspaper.
 -
Narendra Mohan MittalEditor
Narendra Mohan Mittal is a Senior Digital Branding Strategist and Content Editor with over 12 years of versatile experience. He holds an M-Tech (Gold Medalist) and B-Tech (Gold Medalist) in Computer Science & Engineering.
… read more