How to Monitor Website Performance with Blackbox Exporter and Grafana?

Love Grafana for server metrics monitoring? You’ll love Blackbox Exporter for website monitoring too!
In this tutorial, you will learn to install Blackbox Exporter on CentOS/RHEL and understand how to use it with Prometheus and Grafana to monitor website performance and uptime.
Blackbox Exporter by Prometheus is used to probe endpoints like HTTPS, HTTP, TCP, DNS, and ICMP. After you define the endpoint, the Blackbox exporter generates hundreds of metrics that can be visualized using Grafana. Measuring response time is the most important feature of the Blackbox exporter.
Blackbox Exporter is a self-hosted solution. If you’re looking for something similar, but as SaaS or cloud-based, then you can try Grafana worldPing.
Prerequisites
Prometheus and Grafana must be pre-installed. Follow this article to install Prometheus and Grafana.
Blackbox Exporter Installation
Let me show you how to install Blackbox exporter first.
Step 1: Download Blackbox Exporter
Go to the official page to download the latest Linux AMD Blackbox exporter package. I am downloading the blackbox_exporter-0.16.0.linux-amd64.tar.gz file.
- Transfer the downloaded file to the server
- Extract files from the package.
[centos@geekflare ~]$ tar -xzf blackbox_exporter-0.16.0.linux-amd64.tar.gzCheck all the files inside Blackbox exporter.
[centos@geekflare ~]$ cd blackbox_exporter-0.16.0.linux-amd64/
[centos@geekflare blackbox_exporter-0.16.0.linux-amd64]$ ls -l
total 16672
-rwxr-xr-x. 1 centos centos 17050332 Nov 11 2019 blackbox_exporter
-rw-r--r--. 1 centos centos 629 Nov 11 2019 blackbox.yml
-rw-r--r--. 1 centos centos 11357 Nov 11 2019 LICENSE
-rw-r--r--. 1 centos centos 94 Nov 11 2019 NOTICE
Two files blackbox_exporter and blackbox.yml are important here.
- blackbox_exporter: This is an executable file for running the service.
- blackbox.yml: A YAML file with all the backbox exporter configurations which you define all the endpoints to probe and modules to run.
Below command will give you all the flags you can use with Blackbox exporter.
[centos@geekflare blackbox_exporter-0.16.0.linux-amd64]$ ./blackbox_exporter -h
usage: blackbox_exporter [<flags>]

Flags:
-h, --help Show context-sensitive help (also try --help-long and --help-man).

--config.file="blackbox.yml"
Blackbox exporter configuration file.
--web.listen-address=":9115"
The address to listen on for HTTP requests.

--timeout-offset=0.5 Offset to subtract from timeout in seconds.

--config.check If true validate the config file and then exit.

--history.limit=100 The maximum amount of items to keep in the history.

--web.external-url=<url>
The URL under which Blackbox exporter is externally reachable (for example, if Blackbox exporter is served via a
reverse proxy). Used for generating relative and absolute links back to Blackbox exporter itself. If the URL has a
path portion, it will be used to prefix all HTTP endpoints served by Blackbox exporter. If omitted, relevant URL
components will be derived automatically.

--web.route-prefix=<path>
Prefix for the internal routes of web endpoints. Defaults to path of --web.external-url.

--log.level=info Only log messages with the given severity or above. One of: [debug, info, warn, error]

--log.format=logfmt Output format of log messages. One of: [logfmt, json]
--version Show application version.
Step 2: Create User for Blackbox
This is optional.
You may either create a new user to run Blackbox or use existing Prometheus users to run it.
Provide permissions and assign ownership of all its files to the new user.
[centos@geekflare ~]$ sudo useradd -rs /bin/false blackbox
[centos@geekflare ~]$ sudo chmod -R 777 /home/centos/blackbox_exporter-0.16.0.linux-amd64
[centos@geekflare ~]$ sudo chown -R blackbox:blackbox /home/centos/blackbox_exporter-0.16.0.linux-amd64
Step 3: Configure Blackbox Service
It is time to configure Blackbox Exporter as a service inside systemd. Create a file blackbox.service and put the lines mentioned below in the file and save it.
[centos@geekflare ~]$ sudo gedit /etc/systemd/system/blackbox.service

[Unit]
Description=Blackbox Exporter Service
Wants=network-online.target
After=network-online.target

[Service]
Type=simple
User=blackbox
Group=blackbox
ExecStart=/home/centos/blackbox_exporter-0.16.0.linux-amd64/blackbox_exporter --config.file==/home/centos/blackbox_exporter-0.16.0.linux-amd64/blackbox.yml

[Install]
WantedBy=multi-user.target
Don’t forget to change the path to the actual where you have extracted it.
Step 4: Start Blackbox Exporter
Run the commands below to start the Blackbox exporter as a service.
[centos@geekflare ~]$ sudo systemctl daemon-reload
[centos@geekflare ~]$ sudo systemctl start blackbox.service
[centos@geekflare ~]$ sudo systemctl status blackbox.service
● blackbox.service - Blackbox Exporter Service
Loaded: loaded (/etc/systemd/system/blackbox.service; enabled; vendor preset: disabled)
Active: active (running) since Sat 2020-06-13 17:28:40 EDT; 1s ago
Main PID: 30427 (blackbox_export)
Tasks: 5
CGroup: /system.slice/blackbox.service
└─30427 /usr/local/bin/blackbox_exporter --config.file=/etc/blackbox.yml

Jun 13 17:28:40 geekflare.linuxvmimages.com systemd[1]: Started Blackbox Exporter Service.
Jun 13 17:28:40 geekflare.linuxvmimages.com blackbox_exporter[30427]: level=info ts=2020-06-13T21:28:40.283Z caller=main.go:212 msg="Starting b...b9a9)"
Jun 13 17:28:40 geekflare.linuxvmimages.com blackbox_exporter[30427]: level=info ts=2020-06-13T21:28:40.283Z caller=main.go:213 msg="Build cont...SSING)
Jun 13 17:28:40 geekflare.linuxvmimages.com blackbox_exporter[30427]: level=info ts=2020-06-13T21:28:40.283Z caller=main.go:225 msg="Loaded config file"
Jun 13 17:28:40 geekflare.linuxvmimages.com blackbox_exporter[30
Great!
Blackbox exporter has successfully started. At http://localhost:9115/ you can find Blackbox Exporter running.

Integrating Blackbox with Prometheus
Let’s integrate Blackbox Exporter with Prometheus to start scraping the metrics.
- Add a blackbox job with below configurations inside the prometheus.yml file. I am going to monitor the performance of https://www.telegraph.co.uk.
[centos@geekflare ~]$ sudo gedit /etc/prometheus/prometheus.yml

- job_name: 'blackbox'
metrics_path: /probe
params:
module: [http_2xx] # Look for a HTTP 200 response.
static_configs:
- targets:
- https://www.telegraph.co.uk
relabel_configs:
- source_labels: [__address__]
target_label: __param_target
- source_labels: [__param_target]
target_label: instance
- target_label: __address__
replacement: 127.0.0.1:9115 # The blackbox exporter's real hostname:port.- Restart Prometheus.
[centos@geekflare ~]$ sudo systemctl restart prometheus.service- When you check the targets at http://localhost:9090/targets again, you will find a blackbox job running with the endpoint I defined.

- Click on the Graph and run the query – probe_http_duration_seconds.

- A visualization will get created on the data being monitored by Prometheus.

Now it is time to visualize the Blackbox job on Grafana.
There are many ways to get it started, but one of the quickest would be to start with a ready-made dashboard – Prometheus Blackbox Exporter.
- Go to the Grafana dashboard, click on + sign and click on Import.
- In Import via grafana.com, put the dashboard id 7587 and click on Load.
- Then select the Prometheus data source and click on Import.
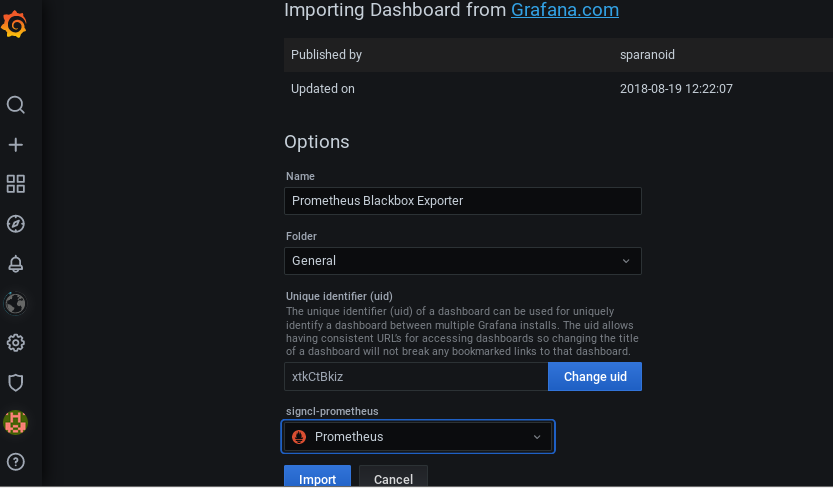
- The Prometheus Blackbox Exporter dashboard will get imported.
- You will be able to visualize metrics like Global Probe Duration, Status, HTTP Duration, Average Probe Duration, Average DNS Lookup, SSL Expiry, and many more.


- These all are separate panels on the dashboard. Let me show the HTTP Duration panel in detail. This panel shows the visualization of time duration taken for connecting, processing, resolve, tls, and transfer requests.

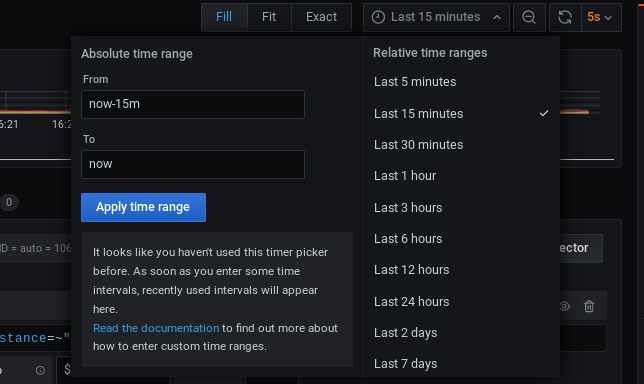
There are a lot many options on the dashboard with which you can play around. You can change the time range for which you want the visualization to appear. You can also change the time interval in data refresh; here, the new data is coming in the dashboard every 5 seconds.
- When you click on the HTTP Duration down arrow, you will get the options shown below. Click on edit.

- Below the visualization panel, you will get a query editor. Currently, the query shown in the below snapshot is getting visualized – probe_http_duration_seconds.

- There are hundreds of queries which you can easily visualize and add it to your dashboard as per the requirement.

- You have plenty of options to change the visualization type also. The average probe duration is present on the dashboard in the text format. From the visualization panel on the right, click on the Guage option for average probe duration.

- And this is how the visualization will change.

Conclusion
The above is just to give you an idea of how easy it is to monitor the website with Prometheus Blackbox and Grafana. There are plenty of options, and I would strongly suggest playing around with it to experience it. If you are curious about learning Grafana, then check out his online course.
-
 AviAuthorAvi is a tech enthusiast with expertise in trending technologies such as DevOps, Cloud Computing, Big Data and many more. He is passionate about learning cutting-edge technologies and sharing his knowledge with others through… read more